Put the effort back on the terrain
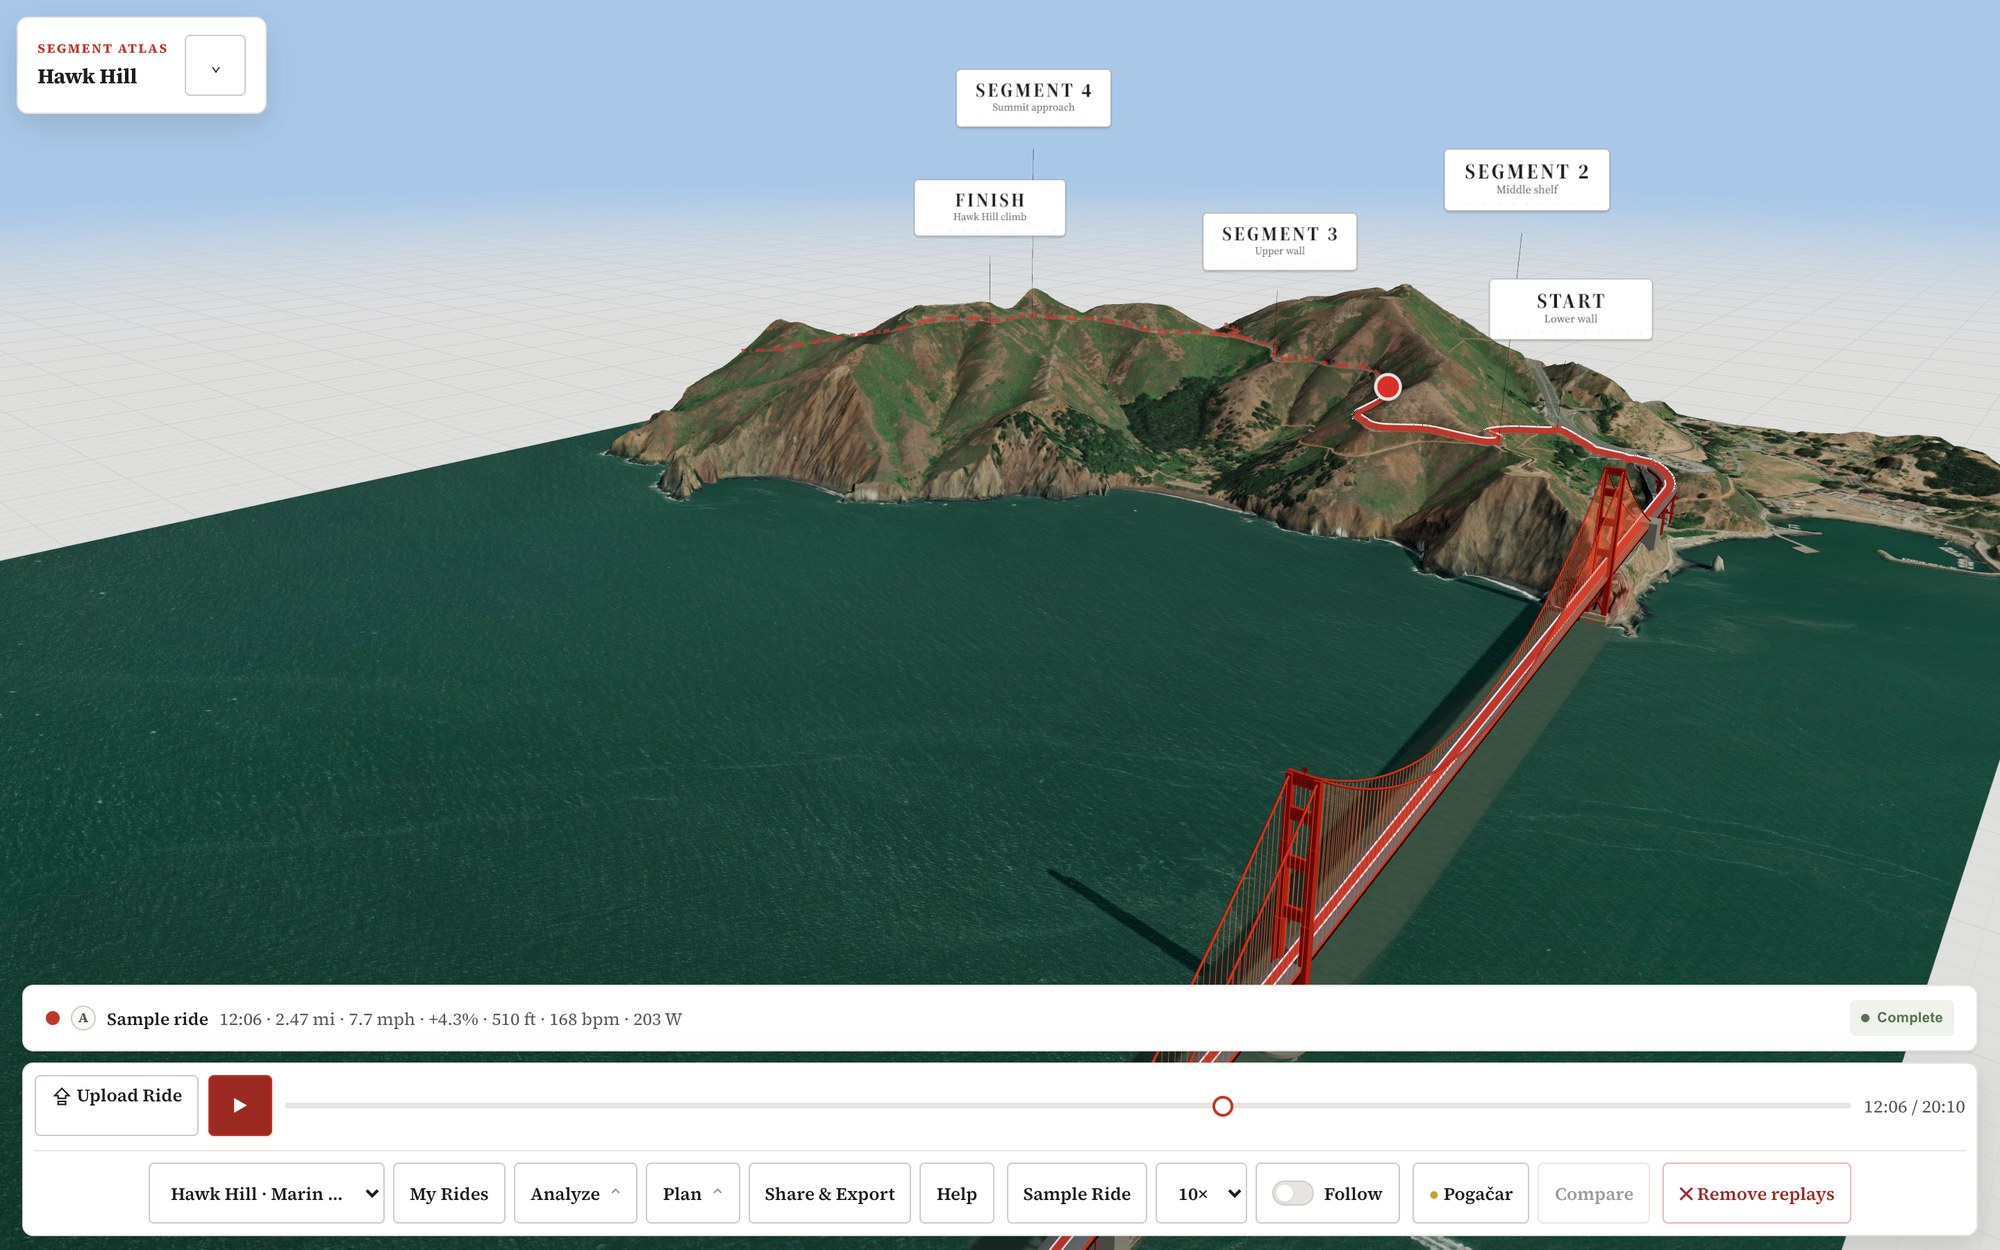
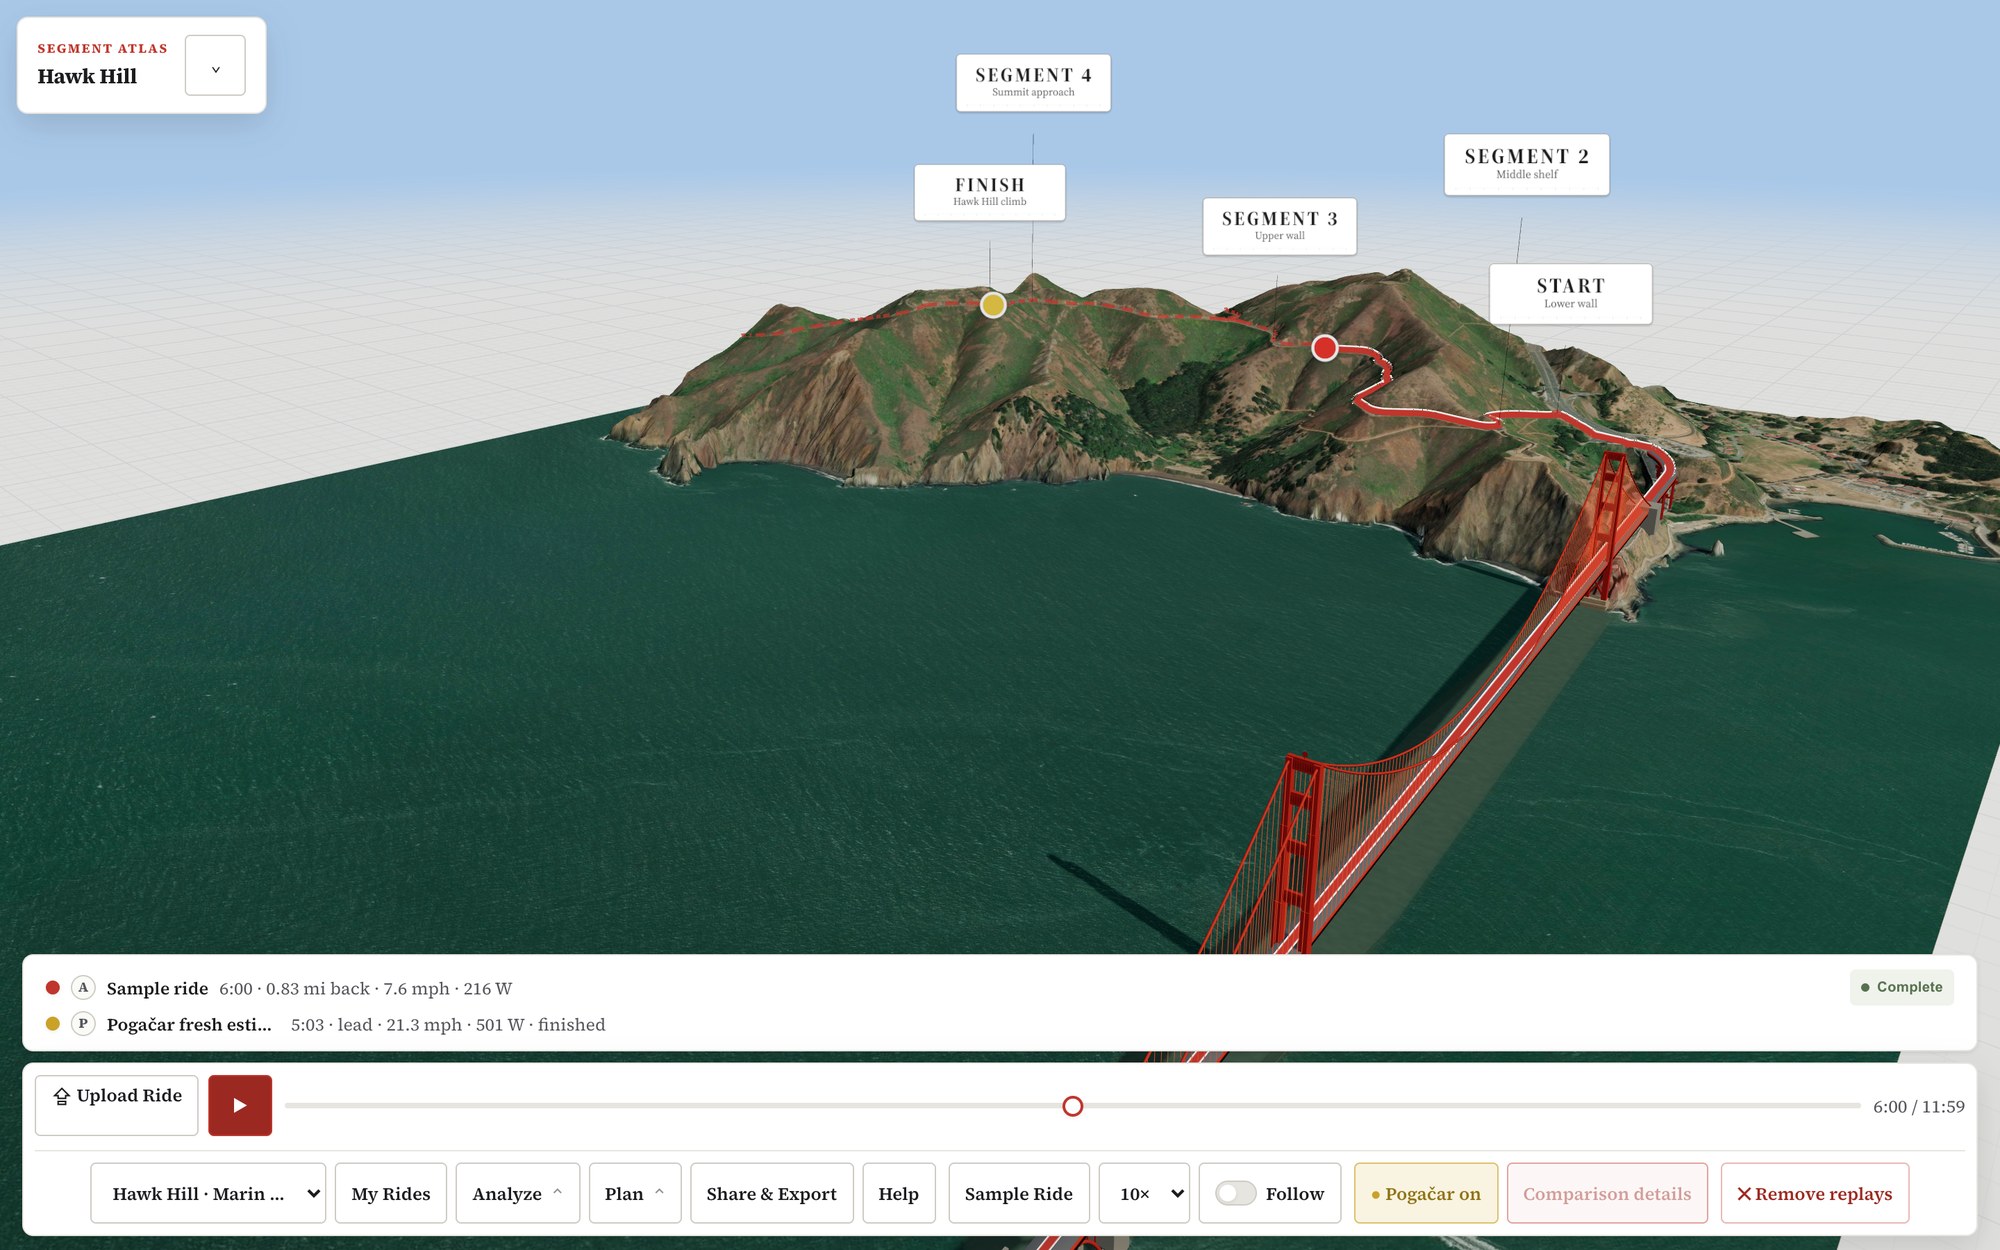
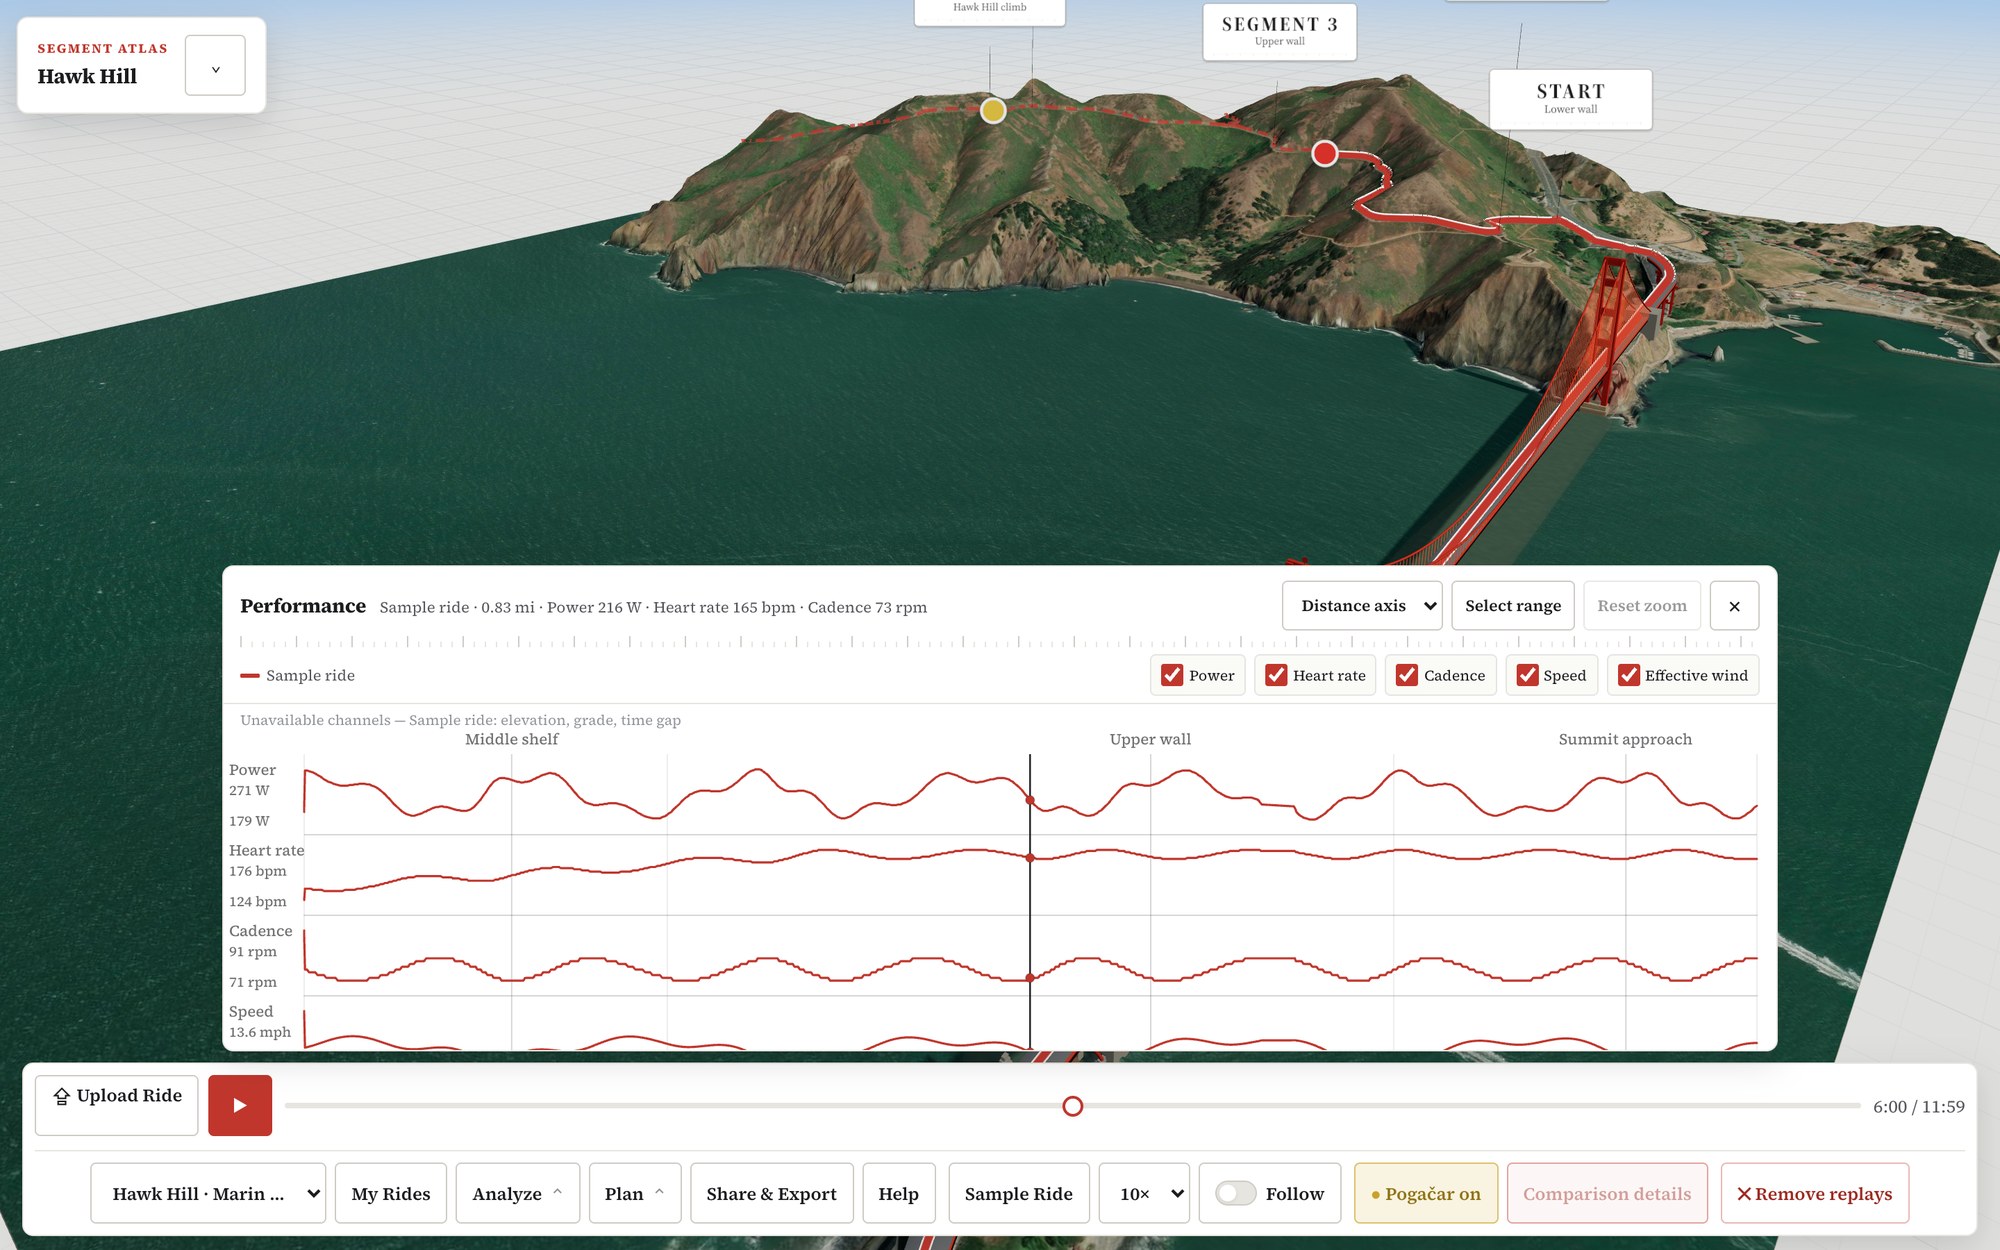
A ride file records every second of an effort, but riders usually see it as flat charts. I wanted them to see where two efforts split apart on the climb itself.
Segment Atlas replays FIT and GPX files over 3D terrain. It ships with three mapped climbs, and its route builder turns a ride anywhere in the continental US into a new mapped route.
Keep the ride local. Fetch the landscape.
Ride files are never uploaded. The route builder fetches public USGS elevation and aerial imagery for the route, and the browser builds the scene on the rider's device.
Parsing and terrain decoding run off the main thread, so the replay stays smooth while a new route loads.
On the rider’s device / browser
- Open a ride Read a FIT or GPX file locally.
- Build the scene Parse and decode in Web Workers.
- Replay & compare Keep the library in IndexedDB.
No ride-file upload. No account. No cross-device sync.
Route building requests public terrain, and wind modeling makes an anonymized weather request. The ride file and saved library remain on the device.
Check the route before building it
With no server to fall back on, a large route could run the browser out of memory. The builder checks route length, terrain area and topology before it fetches anything, and when a route is too big it names the limit it hit.
Keeping everything local has a cost. The ride library lives in one browser, with no sync across devices and no sharing.
Show the ride and the estimate together
Wind can change a result without the rider's effort changing. The comparison shows a modeled calm-equivalent time beneath the recorded one, and the rider picks which of the two sets the ranking.
Route matching shows its evidence too, including how much of the route a ride covered and whether its points ran in order. A partial match comes with the reason.
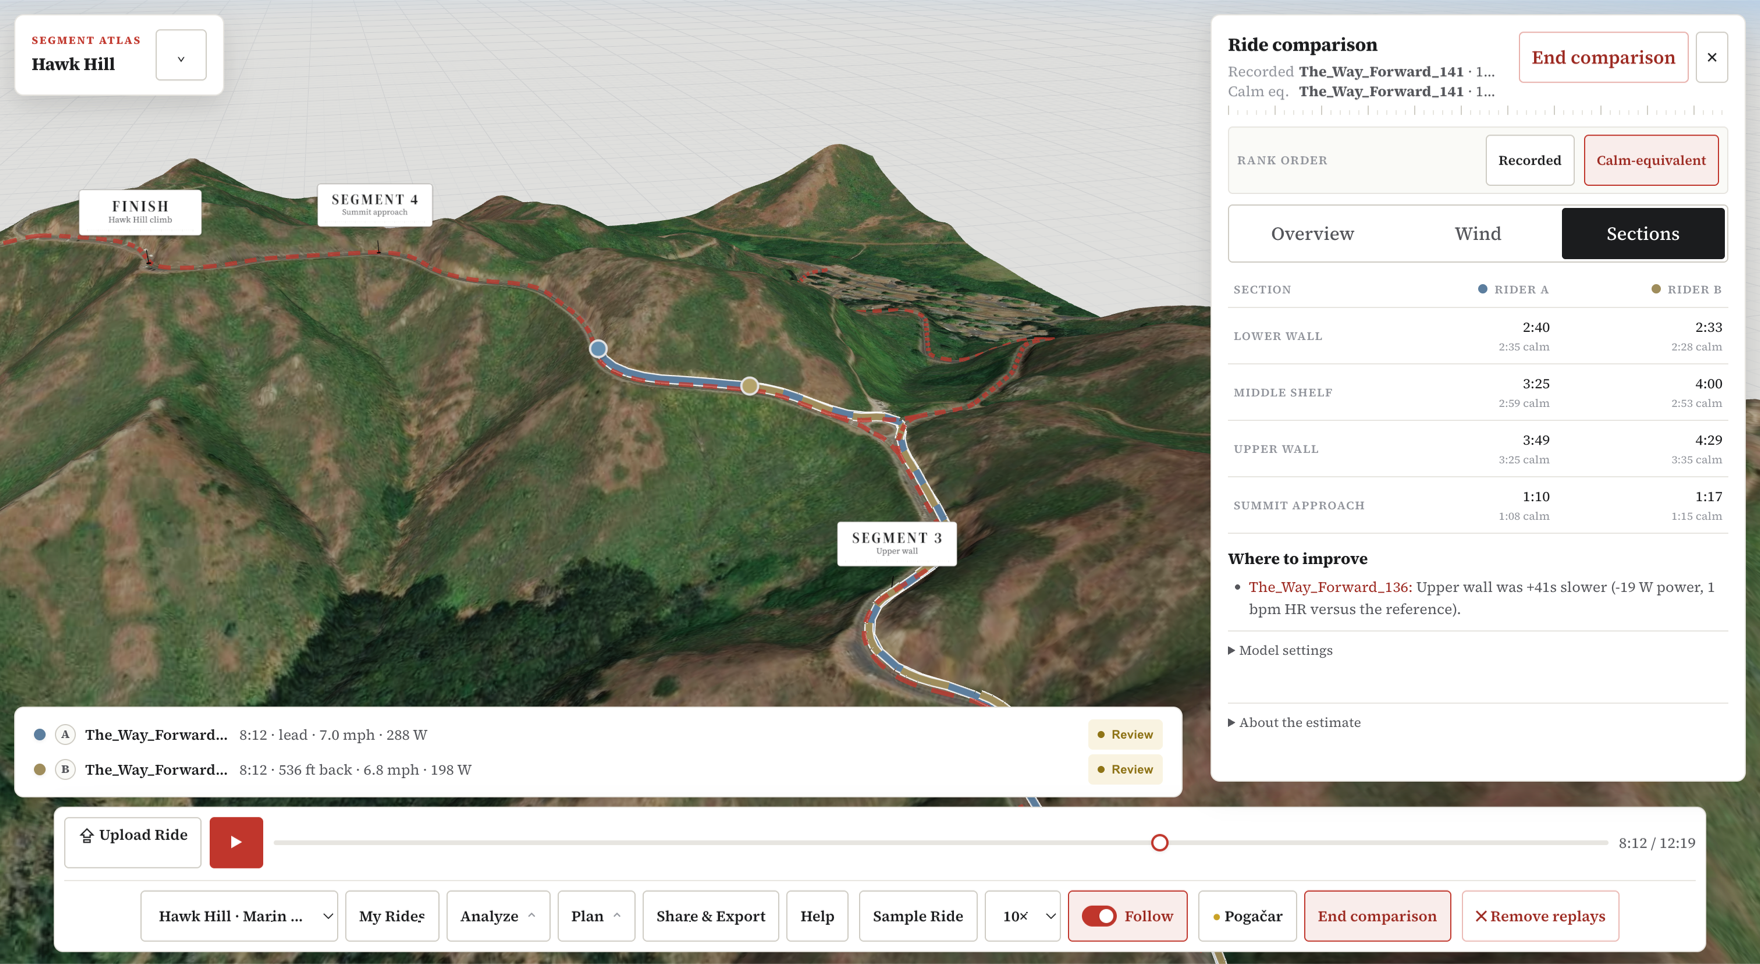
- Recorded first. Modeled beneath.
The lower-wall result remains 2:40. The smaller 2:35 is its calm-equivalent estimate. Both stay visible.
- Changing the ranking is deliberate.
The rider chooses Recorded or Calm-equivalent. This screenshot shows the modeled ranking selected.
Enlarged detail from the product. Select the image to see the full ride replay and comparison.
Built and shipped solo
I did the brand, interaction design, engineering, testing and documentation, building AI-assisted throughout. It works on a phone as well as on a desktop.
An automated test suite covers the physics model, file parsing, comparisons, route topology, storage and performance budgets. It is a portfolio product, so I don't report user numbers for it.